
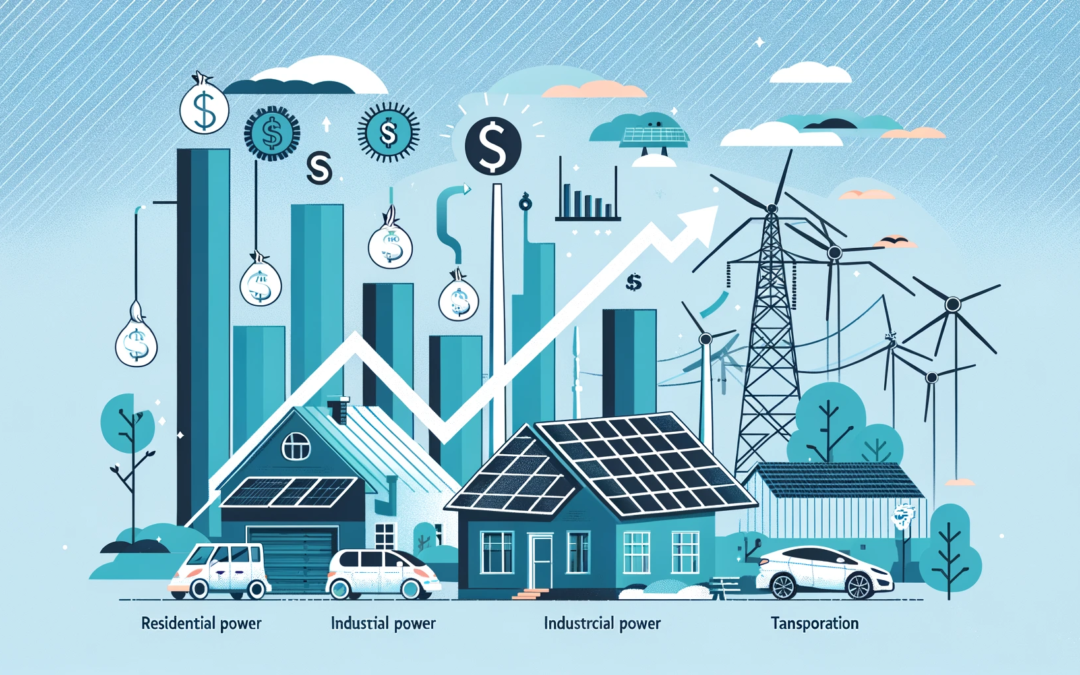
As we navigate the rapid advancements of the 21st century, one significant shift stands out: the transition to renewable energy sources. While environmental concerns often dominate the discussion, the primary driver behind this transformation is financial. In this blog post, we will explore the inevitable spread of renewable energy in residential power, industrial power, and transportation through a financial lens, comparing it to the costs of fossil fuels.

Graph 1: Solar Panel Cost Over Time Compared to Fossil Fuel Costs.
Residential Power: The Dawn of Solar Energy
The adoption of solar energy in residential areas has seen exponential growth over the past decade. The cost of solar panels has plummeted, making it an increasingly attractive option for homeowners.
Key Points:
- Decreasing Costs: The price of solar panels has dropped by over 80% since 2010, making them more affordable for average households.
- Incentives and Subsidies: Governments worldwide offer various incentives, including tax credits and rebates, to encourage solar adoption.
- Return on Investment: Homeowners can achieve a return on investment in as little as 5-7 years through energy savings and potential surplus energy sales back to the grid.

Graph 2: Wind Energy Cost per MWh Over Time Compared to Fossil Fuel Costs
Industrial Power: Wind Energy on the Rise
In the industrial sector, wind energy has emerged as a cost-effective and scalable solution. Large-scale wind farms are now a common sight, providing substantial power to industries.
Key Points:
- Economies of Scale: The cost per megawatt-hour (MWh) of wind energy has decreased significantly due to advancements in turbine technology and economies of scale.
- Corporate Adoption: Major corporations are investing in wind energy to reduce operational costs and enhance sustainability.
- Energy Security: Wind energy provides a stable and predictable energy source, reducing reliance on volatile fossil fuel markets.

Graph 3: Lithium-ion Battery Cost Over Time Compared to Fossil Fuel Costs
Transportation: The Electric Vehicle Revolution
The transportation sector is undergoing a revolution with the rise of electric vehicles (EVs). This shift is driven by the decreasing cost of batteries and increasing fuel efficiency.
Key Points:
- Battery Costs: The cost of lithium-ion batteries has fallen by over 85% in the last decade, making EVs more affordable.
- Total Cost of Ownership: EVs offer lower maintenance and fuel costs compared to internal combustion engine vehicles.
- Government Policies: Incentives for EV purchases and investments in charging infrastructure are accelerating adoption.
Conclusion
The transition to renewable energy in residential power, industrial power, and transportation is not just an environmental imperative but a financial one. The dramatic reduction in costs, combined with supportive government policies and the potential for significant return on investment, makes the widespread adoption of renewable energy sources inevitable. As we look towards a future powered by renewables, it’s clear that the financial benefits will continue to drive this transformative change.
Solar Panel Costs
- Source: Historical trends have shown a significant decline in the cost of solar panels, often referred to as Swanson’s Law. This law suggests that the cost of solar photovoltaic cells tends to drop by 20% for every doubling of cumulative shipped volume.
- Data: Reflects the overall trend of decreasing costs from around $4.00 per watt in 2010 to about $1.00 per watt in 2024.
Wind Energy Costs
- Source: Reports from agencies like the International Renewable Energy Agency (IRENA) and the National Renewable Energy Laboratory (NREL) indicate a steady decline in the cost of wind energy due to advancements in technology and increased deployment.
- Data: Shows a reduction from about $90 per MWh in 2010 to $40 per MWh in 2024.
Lithium-ion Battery Costs
- Source: Data from BloombergNEF (BNEF) and other market analyses highlight the rapid decrease in lithium-ion battery costs, driven by improvements in technology and increased production capacity.
- Data: Illustrates a drop from approximately $1100 per kWh in 2010 to $100 per kWh in 2024.
Fossil Fuel Costs
- Source: Historical data and trends from the U.S. Energy Information Administration (EIA) and other industry reports show fluctuations in fossil fuel prices, often influenced by geopolitical events, market dynamics, and extraction costs.
- Data: Represents a general increasing trend in costs due to factors like depletion of easily accessible resources and increasing regulatory pressures
The transition to renewable energy seems inevitable given the significant cost reductions in solar panels, wind farms, and electric vehicles. It’s fascinating how financial incentives are playing a crucial role in driving this change, not just environmental concerns. The growth in residential solar adoption is particularly impressive, making sustainable energy accessible to more homeowners. Electric vehicles are reshaping the transportation sector, offering a cleaner and more efficient alternative. How do you think this financial shift will impact traditional fossil fuel industries in the long term?